
Charts, Statistics, and Data Thinking Poster Topics
Need to make a Charts, Statistics, and Data Thinking Poster poster? Find topic options, copy references, section ideas and layout suggestions.
Topics you can use

How to Make a Handwritten Newspaper About Mean, Median and Mode
Mean, median and mode are easy to mix up. This poster plan keeps them separate: define each value, run one made-up data set through all three columns, then add a clear tip strip on which value to use when.
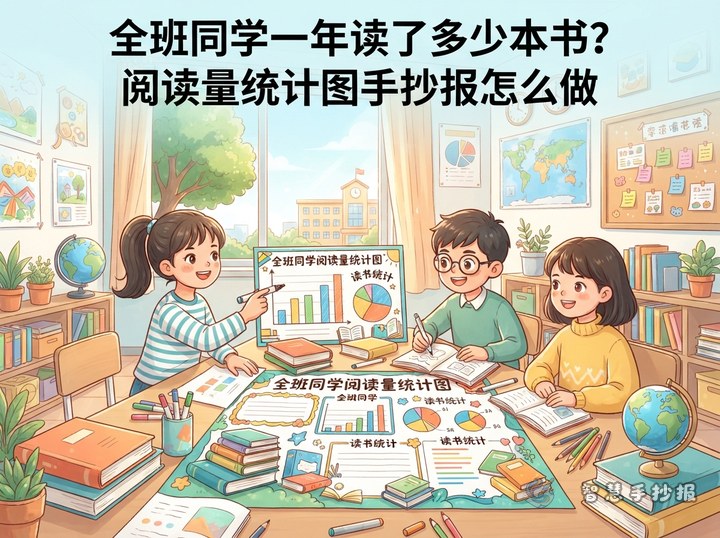
How Many Books Does Your Class Read in a Year? Making a Reading Statistics Poster
A reading statistics poster works best when one clear question turns into numbers you can compare. This article shows how to run a quick class survey, draw a bar chart with a proper axis, add an average card and highest-lowest facts, and write three short conclusion sentences. It also suggests a four-block layout for the title, charts, findings and tips, plus a step-by-step checklist for finishing the poster neatly.
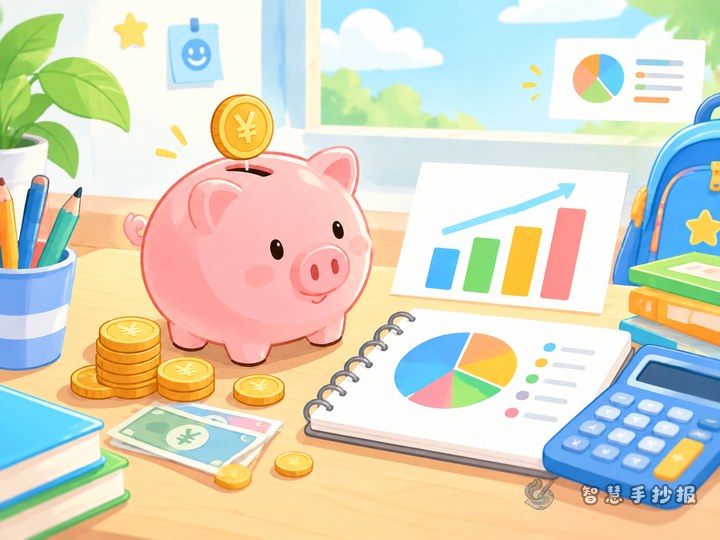
Where Does My Pocket Money Go? A Statistics Chart Handwritten Newspaper Guide
This handwritten newspaper topic focuses on where pocket money goes. Children first choose a clear statistics question, then collect one week or one month of spending records. They use a bar chart to compare items and a pie chart to show proportions, arrange title, chart, note, and conclusion areas, and finish with a short data finding. Great for primary school students, parents, and teachers.
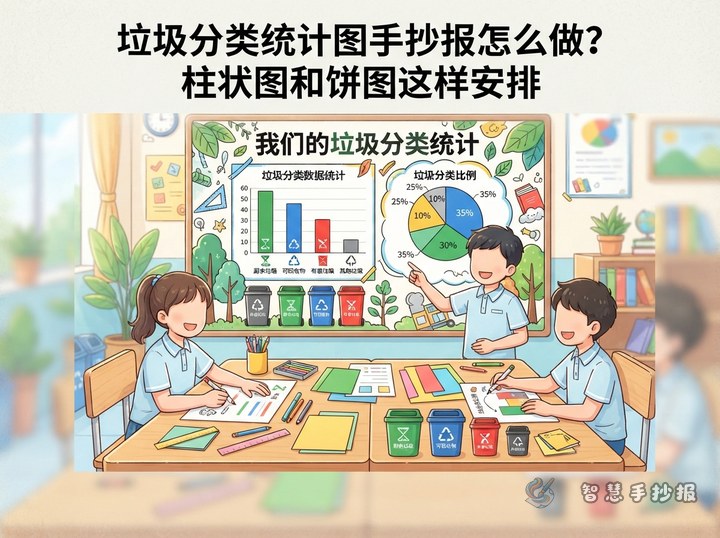
How to Make a Waste Sorting Statistics Hand-Copied Newspaper
Create a waste-sorting statistics hand-copied newspaper by recording paper, plastic, food waste, and other waste at home or school. Use a bar chart to compare amounts, a pie chart to show proportions, and short action ideas to connect data with greener daily habits.
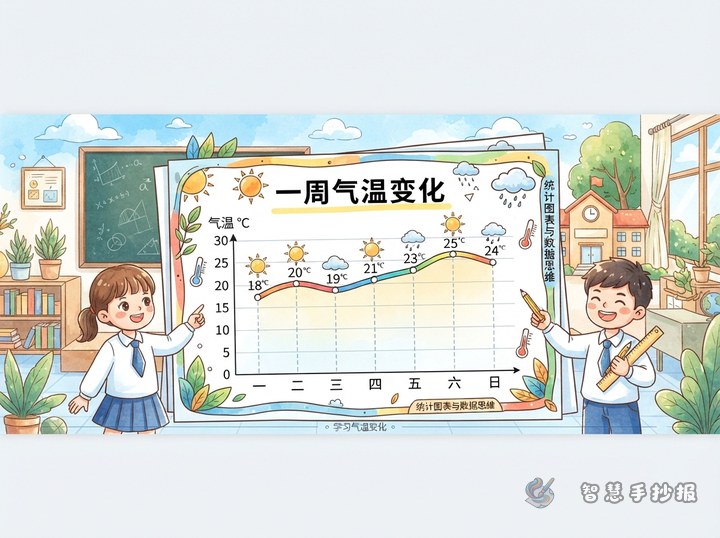
How Do You Make a Weekly Temperature Line Graph Poster?
This guide helps students turn seven days of temperature observations into a clear line graph poster. It covers consistent data collection, axes and scales, trend analysis, short writing materials, weather-themed decorations, and an easy-to-follow page layout.
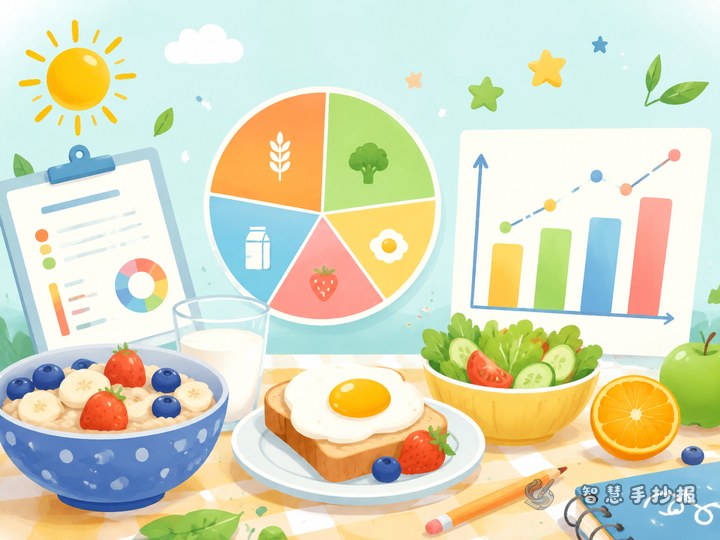
Does My Breakfast Have Enough Variety? A Data-Chart Hand Poster Plan
Turn several days of breakfast observations into a bar chart or a carefully chosen pie chart. This guide offers layout ideas, adaptable wording, data-labeling tips, and a step-by-step plan for a clear school poster.
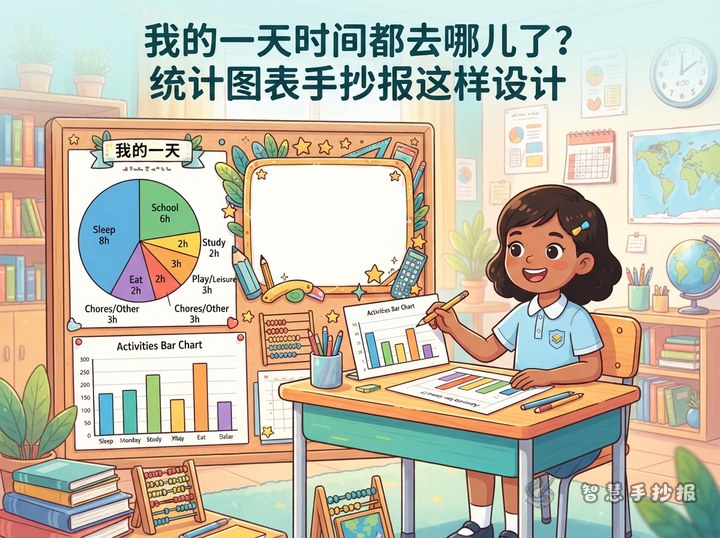
Where Does My Time Go? A Charts and Data Handwritten Newspaper
This guide uses “Where Does My Time Go?” as a creative theme. It explains how to record everyday data, choose a suitable chart, arrange sections, and add opening lines, conclusions, and layout ideas so children can connect data thinking with daily life.

How to Draw a Class Sports Preference Statistics Handwritten Newspaper?
This guide turns a class sports preference survey into a clear handwritten newspaper. It includes survey ideas, bar chart instructions, section wording, layout suggestions, and data checks so children can practice recording, comparing, and explaining simple information.

How Do You Turn a Week of Water Use into a Handwritten Newspaper Chart?
Use one week of household water-use observations as the subject of a data-thinking handwritten newspaper. This guide explains how to collect comparable records, choose a bar or line chart, arrange the page, write a conclusion, and add practical water-saving actions.
Want to create a poster now?
Scan with WeChat, enter this theme, and generate the layout, section copy and line art.
 Scan with WeChat