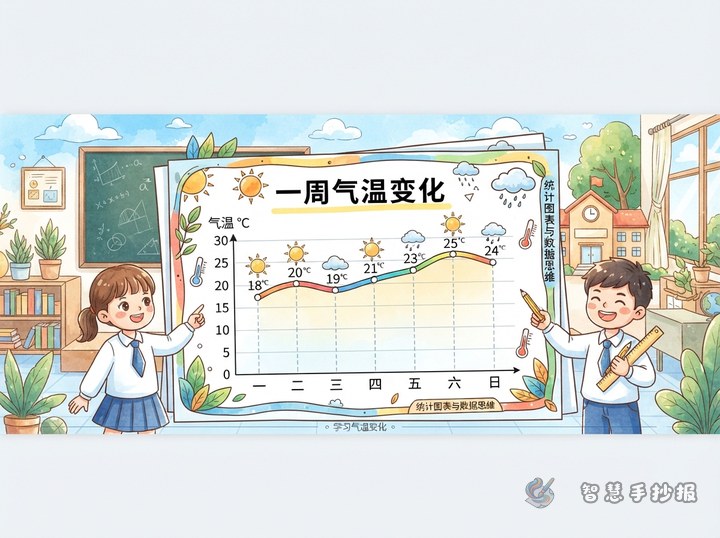

Start with a Class Sports Survey
This handwritten newspaper can focus on the question “Which sports do our classmates like?” Begin with a simple survey and turn the results into a clear chart. Choose a manageable number of options, such as basketball, football, jump rope, running, badminton, and other. Each student can select one favorite activity. The survey gives the page a real classroom focus while showing basic data thinking.
What to Include on the Page
A suitable title could be “Our Class Sports Survey” or “Sports Interests in Numbers.” Suggested sections include “How We Surveyed,” “The Results,” “What We Discovered,” and “Healthy Activity Tips.” Explain who was surveyed and how answers were recorded. Label the number of students for each sport, compare the most and least popular choices, and finish with a reminder to choose suitable activities and exercise regularly.
Ready-to-Use Text
- Survey note: We organized our classmates’ sports choices into a chart through a simple survey.
- Data discovery: The height of each bar shows the number of students. A taller bar means more students chose that sport.
- Activity message: Make time for exercise every day and enjoy the benefits of teamwork, practice, and persistence.
Choosing and Drawing the Chart
A bar chart is best when you want readers to compare the numbers quickly. Write the sports along the horizontal axis and the number of students along the vertical axis, using equal intervals such as 1, 2, 3, and 4. Different colors can be used for the bars, but keep the palette limited. A pie chart can show each sport’s share of the whole group, with a legend and number labels beside it. For most elementary school projects, a bar chart is simpler and easier to read.
Page Layout and Decoration
Place the title at the top center. Put the survey method and a small questionnaire symbol on the left, and give the main chart a prominent position in the center or on the right. Use the bottom area for discoveries and exercise tips. Small drawings of a basketball, football, jump rope, running shoes, or a scoreboard can add a lively school-sports feeling. Leave enough white space around the chart so that numbers and axis lines remain visible.
Four Final Checks
- Make sure each sport, color, and number match correctly.
- Use equal intervals on the bar chart instead of changing the scale for appearance.
- Check that the survey total matches the data shown in the chart.
- View the page from a distance to see whether the title, legend, and conclusion are easy to understand.
To organize the title, sections, and layout more quickly, continue in the Zhihui Handwritten Newspaper WeChat Mini Program. You can adjust the chart position to fit the paper size and then handwrite or print the text you like.