Turn everyday waste into a question you can count
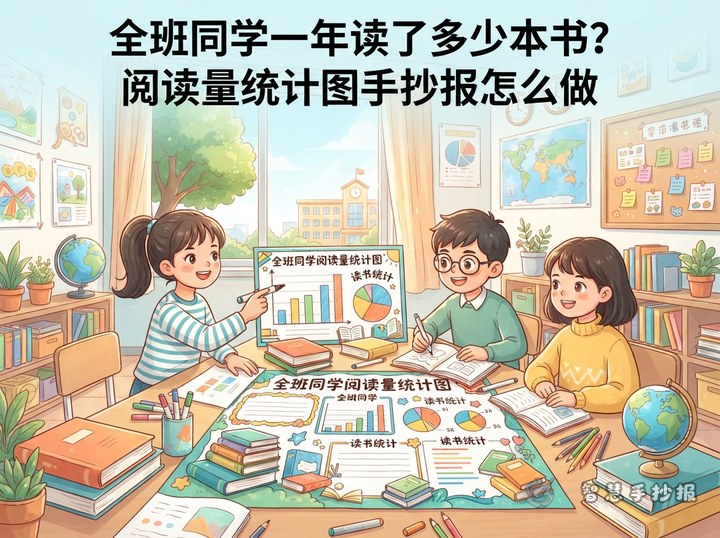
This hand-copied newspaper can begin with waste from home, the classroom, or the schoolyard. Start with one clear question: Which type of waste appears most often? How much is recyclable and how much is not? A clear question makes the chart easier to understand.
You may record waste for three days, during one recess, after lunch, or while tidying at home. Keep the categories simple: paper, plastic, food waste, and other waste. Count everything in the same way, such as by item or by bag.
Make a small data record card
Draw a table on the left side of the page with the date, category, and number collected. For example: 12 paper items, 8 plastic items, 15 food-waste items, and 5 other items. Use numbers from your own observation; the data do not need to be large or complicated.
- Observation tip: Use one counting method for each category.
- Recording tip: If an item is hard to classify, mark it and decide later.
- Safety tip: Observe and count only. Do not touch dirty or sharp waste.
Use a bar chart to compare the amounts
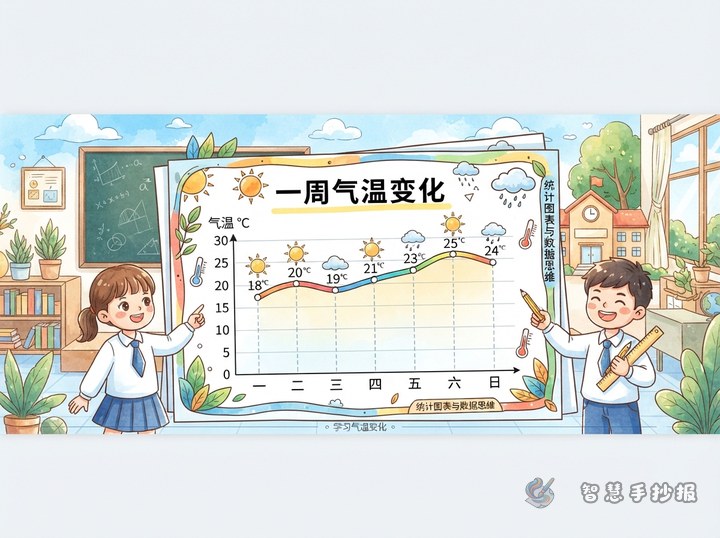
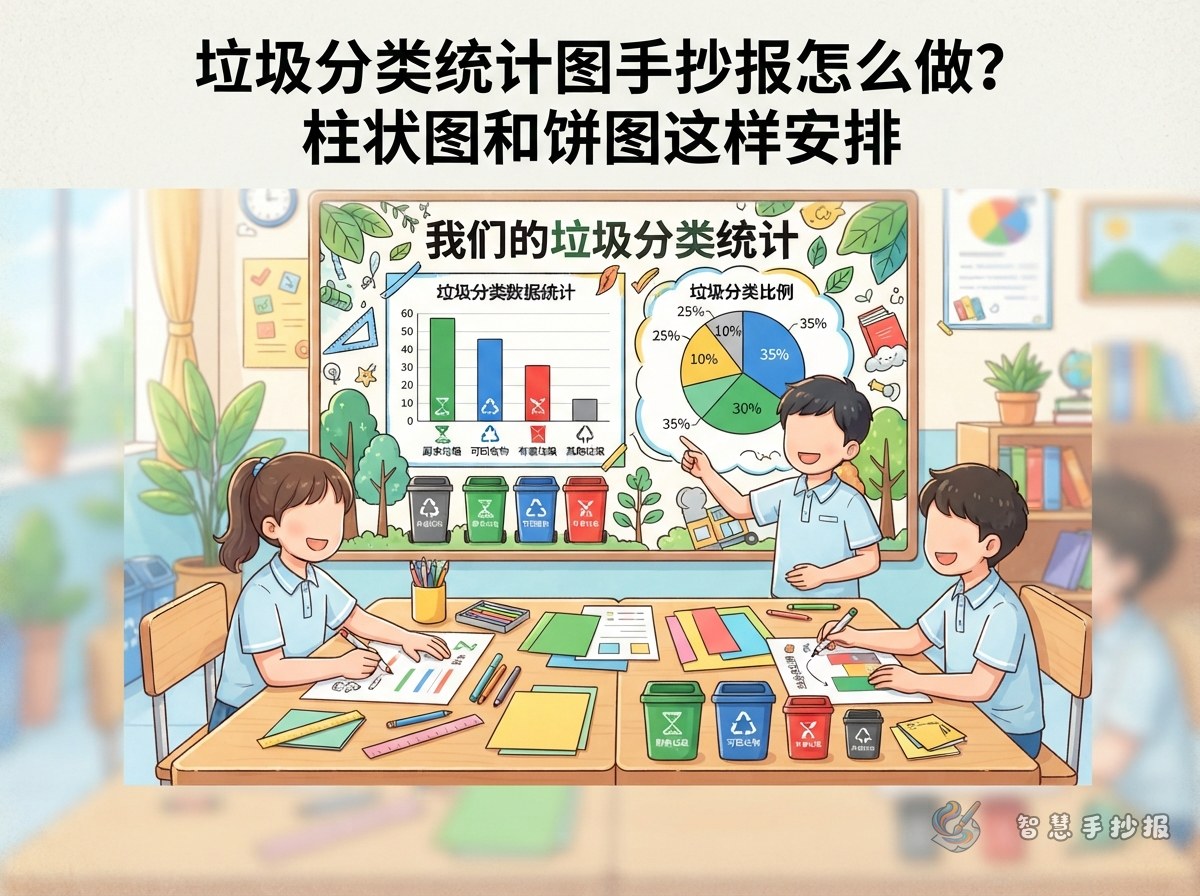
A bar chart works well in the center of the page. Put waste categories on the horizontal axis and numbers on the vertical axis. Begin at zero, use equal intervals, and write each number above its bar. Different colors help readers compare the categories quickly.
Next to the chart, add a sentence based on your data: “Food waste was the largest group in this survey, so we should take only the food we can finish.” Your conclusion should come from the numbers, not from a general slogan alone.
Add a pie chart to show proportions
Place a simple pie chart in the lower right corner. Treat the full circle as the total amount of waste. If exact percentages are difficult, use data that are easy to divide or write approximate phrases such as “about half” and “about one quarter.” The pie chart shows each category’s share of the total.
Short notes for the pie chart
- If recyclables take a large share, check whether they are being sorted correctly.
- If food waste is high, encourage students to avoid taking too much food.
- If other waste is high, see whether paper boxes or bottles could be recycled instead.
Finish with an action box
Create a section called “What I Can Do” at the bottom. Include practical ideas such as bringing a reusable bottle, using both sides of paper, taking a proper portion of food, and putting recyclables in the correct bin. A good heading is “What the Numbers Teach Me About Being Green.”
Use green, blue, and orange for a bright layout, and leave enough blank space around the charts. A title such as “My Waste Sorting Survey” works well. After making a draft, you can continue arranging the page, borders, and text materials in the Smart Handwritten Newspaper WeChat mini program.