
Set the angle first: recording, not predicting
Many students start writing about seismographs and end up describing a machine that predicts earthquakes. That shifts the whole poster off topic. A seismograph does something simpler and more interesting: it turns invisible shaking into a line anyone can read. Put that sentence at the top of the page as a headline or opening line and the rest of the layout falls into place.
Give the poster a title with movement in it, such as "From shaking ground to a drawn line" or "A day at a tiny monitoring station". It works far better than a flat label like "Introduction to seismographs".
Three facts that can fill the whole page
One: waves arrive at different times
When an earthquake happens, different kinds of waves travel at different speeds. The faster one arrives first and feels like a sharp jolt; the slower one arrives later and shakes for longer. Draw two curves setting off one after the other and add a short caption such as "the fast wave reports first". It explains more than a paragraph.
Two: the instrument relies on inertia
Inside the instrument a mass hangs from a support. When the ground shakes, the mass tries to stay as it was, so the mass and the ground move apart. That movement is converted, amplified and recorded. Three words cover it: inertia, conversion, recording.
- Sensor part: feels the ground move
- Conversion and amplification: turns movement into a usable signal
- Recording part: draws the signal against time
- Time marks: tell the reader when each wobble happened
Three: magnitude is calculated
The curve is not decoration. Its height and how long it lasts are data. Specialists use that data to work out the size and the location of the earthquake. Younger students do not need formulas; a sentence like "a steeper, longer curve means stronger shaking" is enough.
Lay the page out as a journey
Instead of cutting the page into four equal boxes, run the story from left to right:
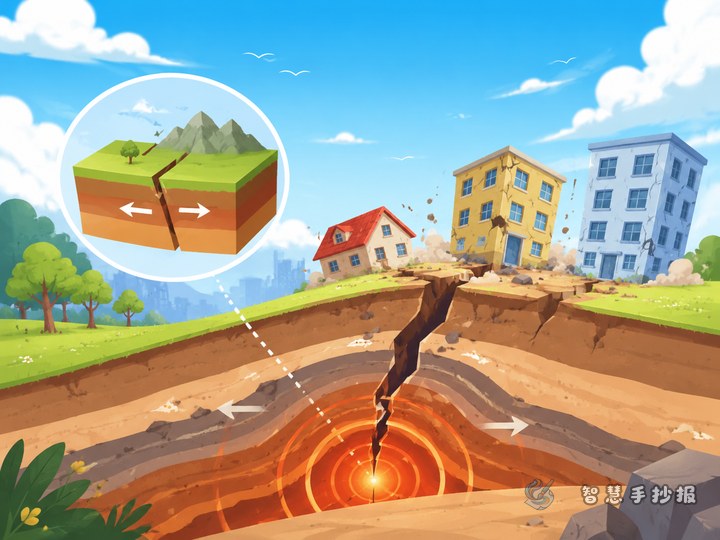
- On the left, draw ground and small houses with the caption "the ground starts to move"
- In the middle, draw a simplified seismograph and label the hanging mass
- On the right, draw a wavy line labelled "the earthquake drawn on paper"
- Along the bottom, add a narrow strip listing three uses: monitoring, early warning and research
Keep the central drawing large and leave clear writing space around it so the page still feels calm.
Short lines students can copy
- The ground moves, the instrument records, people read.
- A seismograph is not a fortune teller; it is a careful note-taker.
- One shake, one line, one piece of evidence to study again and again.
- Fast wave first, slow wave later, and the gap between them is information.
- It turns invisible shaking into a language we can understand.
Bonus: sketch a model you could build
Save a corner of the poster for a hands-on box. Draw a paper cup hanging from a thread with a pen tip resting on a strip of paper below. When the table is tapped, the paper strip picks up a crooked line. Add the caption "try it: the harder you tap, the more the line bends". It links the science to something readers can test themselves.
Once the title, drawing and short lines are in place, you can open the Smart Handwritten Poster WeChat mini program to choose a layout and border style and turn the draft into a finished page.