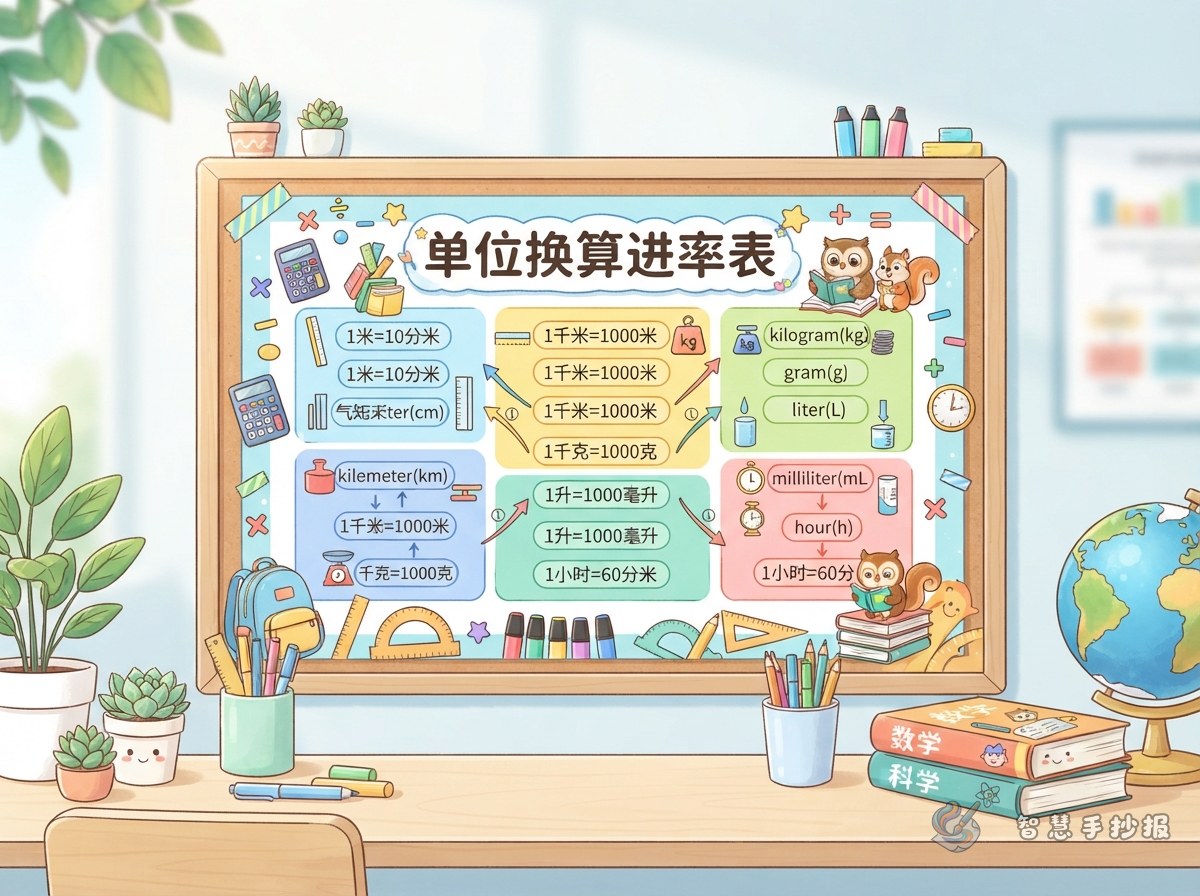
Start with the problem this poster should solve
Many children try to fit length, area, time and mass onto one page, and the result looks like a dictionary nobody wants to read. Unit conversion really has only two trouble spots: mixing up the rates and using the wrong direction. A poster built around one main table keeps the page calm and useful.
The main chart: one row for each family of units
Give the centre of the page to the table. Draw five rows and place the rate between neighbouring units next to each arrow, so the reader can see at a glance whether to multiply or divide.
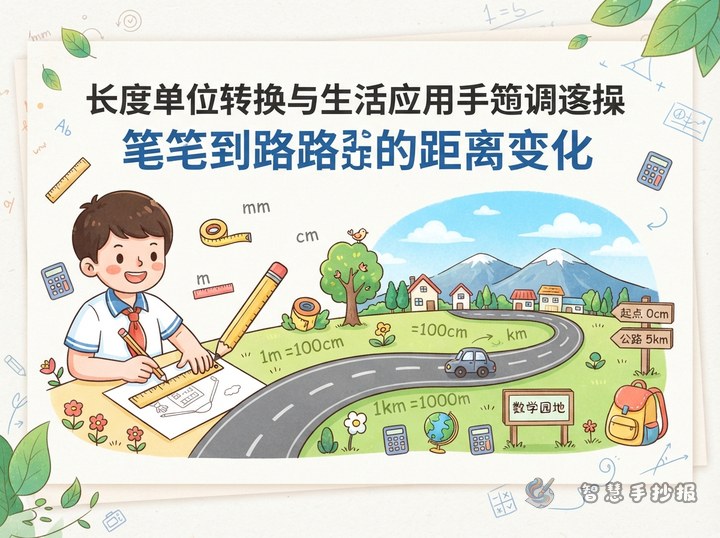
- Length: kilometre, metre, decimetre, centimetre, millimetre. The rates between the smaller steps are 10, while metres and centimetres use 100, and kilometres and metres use 1000.
- Mass: tonne, kilogram, gram, with 1000 between each step.
- Capacity: litre and millilitre, with a rate of 1000.
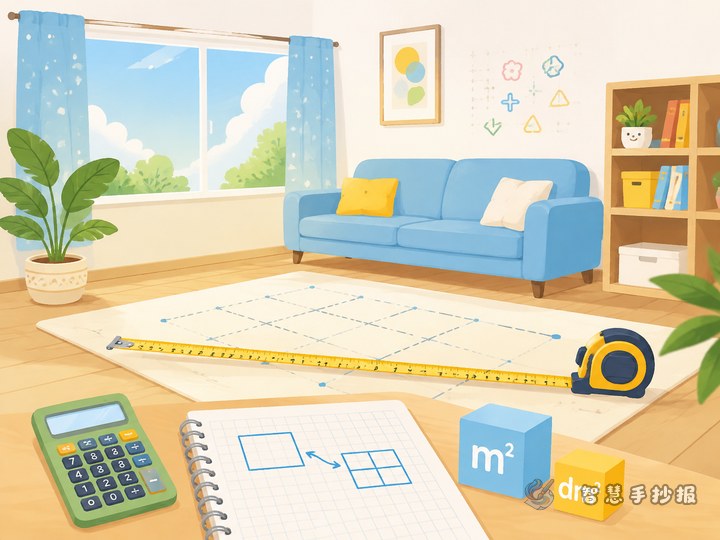
- Area: square metre, square decimetre, square centimetre, with 100 between each step, and 10000 between hectares and square metres.
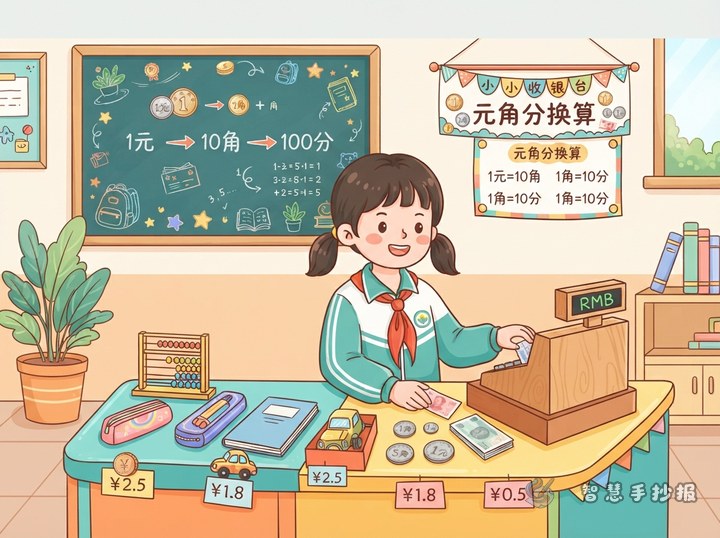
- Money: yuan, jiao and fen, with a rate of 10.
Add a “my own example” column
Leave a narrow column for one familiar object in each row: a desk for length, a bag of salt for mass, a water bottle for capacity, a floor tile for area and a pencil for money. The table then becomes a set of pictures instead of bare numbers.
Make the chart work: the decimal point rule
The table only stores the rates. The real work happens when the point moves. Write this rule in large letters below the table: big unit to small unit, multiply and move the point right; small unit to big unit, divide and move the point left.
- Circle the two units and decide which one is larger.
- Find their rate in the main table.
- Move the decimal point one, two or three places to the right or left.
- Fill missing places with zeros, then write the unit after your answer.
Layout: chart in the middle, reminders on both sides
Divide the paper into three parts. The middle half holds the table and the rule. The left strip lists everyday measurements. The right strip holds a brightly framed common mistakes box. Put the largest title at the top and leave one small line for name and class.
Lines for the common mistakes box
- Area rates are 100, not 10 like length rates.
- Time is not decimal, so keep hours and minutes outside the main table.
- Check your answer: when the unit becomes smaller, the number should become larger.
Sentences you can copy straight onto the page
- One table, five unit families, no more mixed-up rates.
- Check the unit, find the rate, then move the point.
- Big to small, multiply; small to big, divide.
- Unit conversion is not about reciting numbers, it is about measuring real life.
If drawing the grid takes too long, open the Smart Handwritten Newspaper mini program in WeChat, choose a unit conversion template, type in the table and sentences above, and adjust the colours or column positions to suit your own style.